How We Build Our Picks: The Machine Behind the Weekly Brief
The full method behind the weekly brief: market moneylines stripped to no-vig win probabilities, a spread cross-check that flags a market arguing with itself, Yahoo ownership, and an equity model that prices the fade.
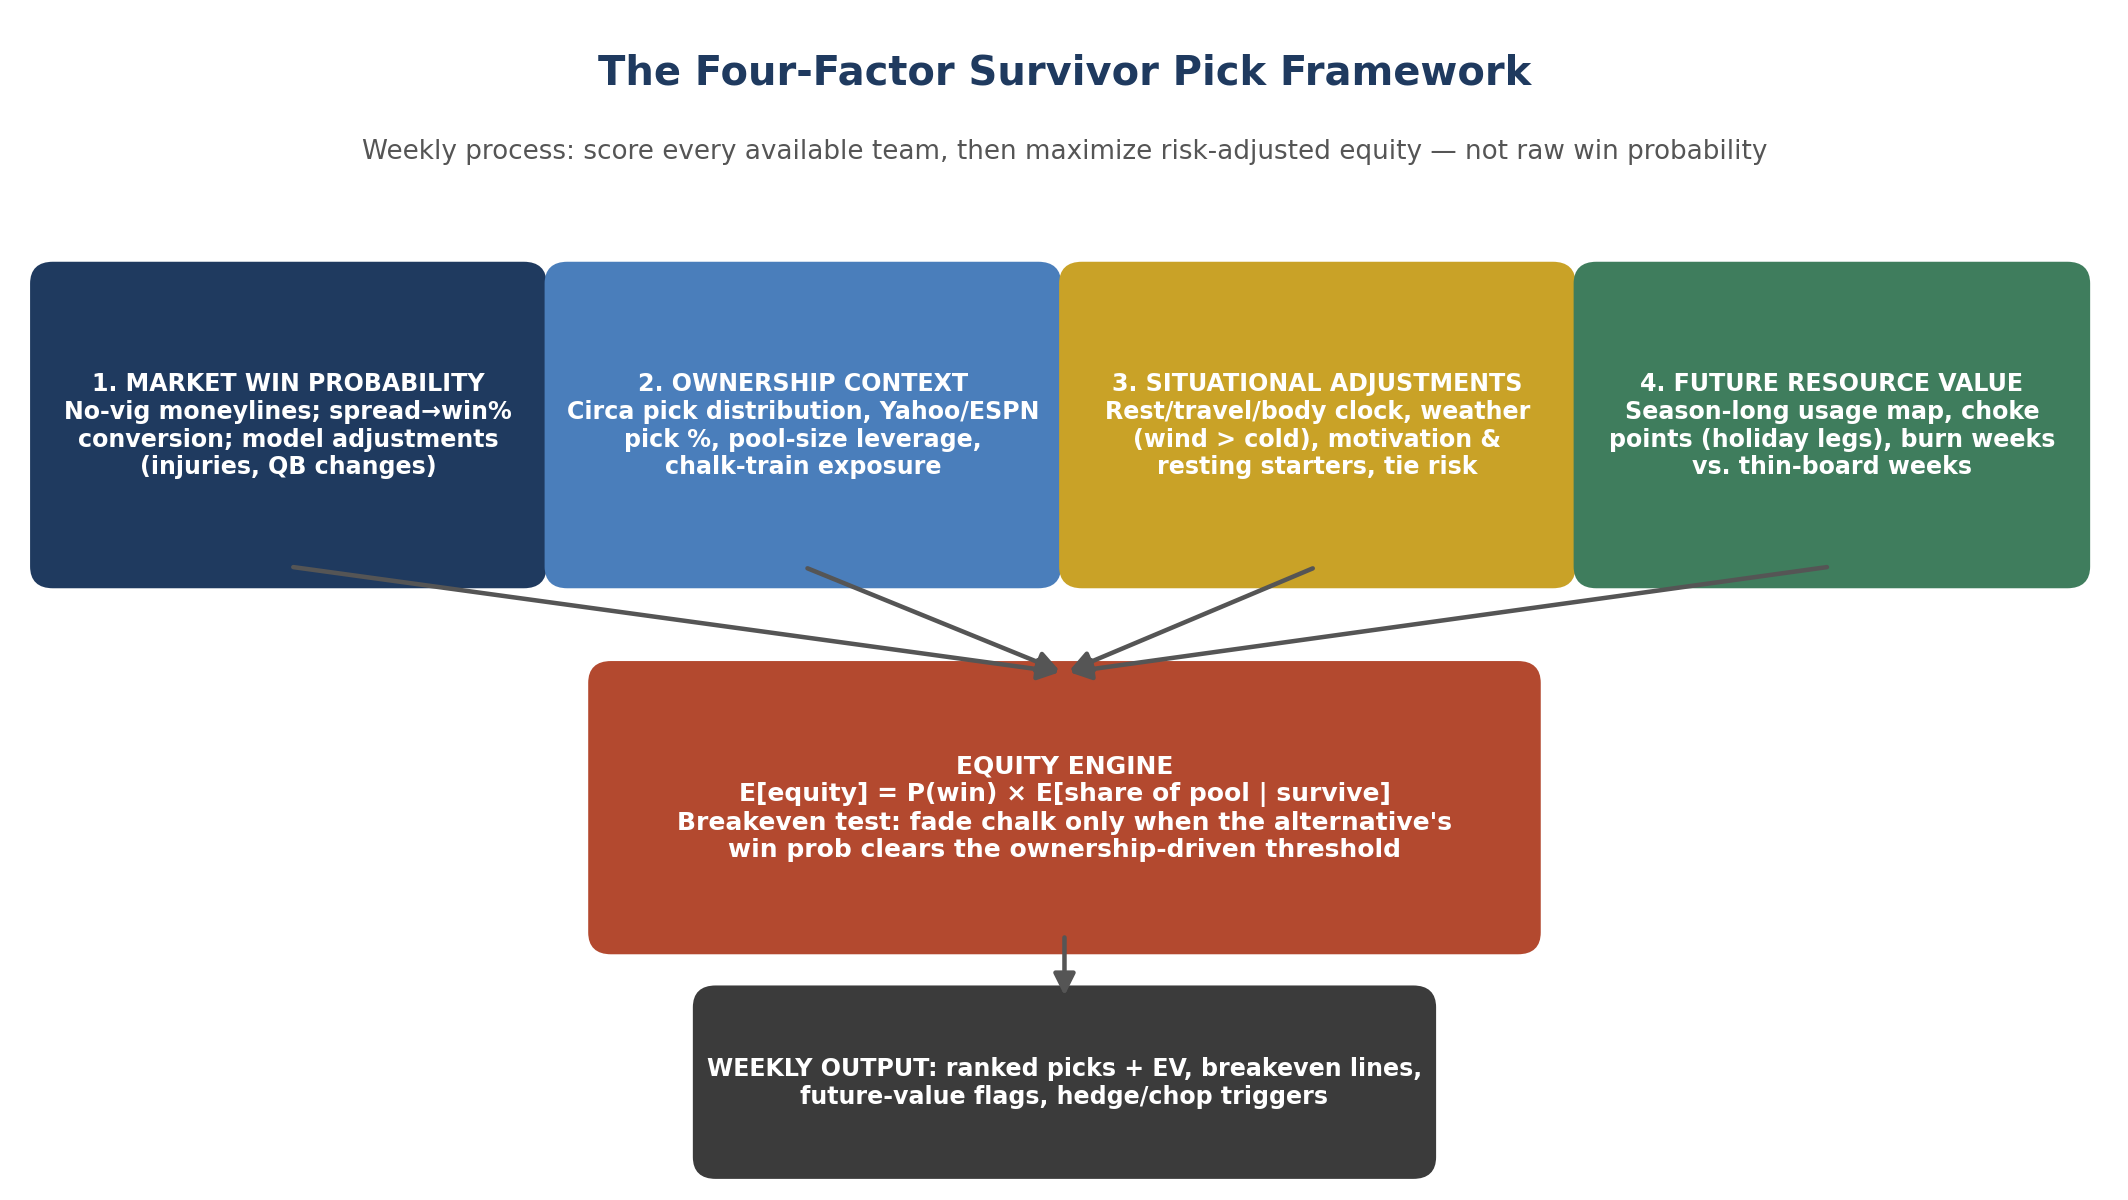
Every Wednesday this season we publish a brief — slate, chalk, fade budget, pick. This post is about the machine behind it. Five steps, fully mechanical, indifferent to whether we "like" a team — which is the entire point.
Step 1: Pull the market
Everything starts with the betting market — the only win-probability
oracle paid for being right. Our pipeline pulls the schedule —
moneylines and point spreads included — from
nflverse,
caching every fetch under data/raw/ so any week is reproducible
offline.
Step 2: Strip the vig, cross-check the spread
A moneyline isn't a probability until you remove the bookmaker's cut. Convert both sides to implied probability and normalize to sum to 1. Thanksgiving 2025: Eagles −315 / Bears +255 gives raw implied probabilities of 75.9% and 28.2% — a 4.1% overround — normalizing to 72.9% / 27.1% no-vig (PhillyVoice).
Then we cross-check the spread→win% curve four decades of NFL results built: −3 wins about 59.4% straight up, −7 wins 75.2%, −10 wins 83.6% (Boyd's Bets). The moneyline and the spread are two views of one market. Disagree by 4 points or more and the engine flags it: a market arguing with itself means a wider error band, not a pick.
Step 3: Count the crowd
Win probability is half the decision; the other half is who else owns your team. We use Yahoo's pick distribution as the crowd proxy — Circa publishes actual picks after each leg locks, which we'd weight for sharp contests. Outside Circa, assume a ±10-point error bar.
Step 4: The equity model
The math at the engine's center, for a pool with N entries alive: the chalk wins with probability p_c and is owned by a share c of the field; the non-chalk field averages win probability q; your alternative wins with probability p_a:
- Ride the chalk: E = p_c / (1 + (N−1)·[c + (1−c)·q])
- Fade to the alternative: E = p_a · [ p_c / (1 + (N−1)·[c + (1−c)·q]) + (1−p_c) / (1 + (N−1)·(1−c)·q) ]
The second term is the whole game. It's leverage: with probability (1−p_c) the chalk loses, everyone riding it dies, and you survive into a field shrunk to (1−c) of its former size. A 75% favorite owned by half the pool moves you with the herd when it wins and kills you with them when it loses — full risk of the week, no upside.
The breakeven produces a permission slip with strict limits — the win probability you may sacrifice to fade, by chalk ownership (1,000-entry pool, non-chalk field averaging 62%):
| Chalk win prob ↓ / Ownership → | 10% | 25% | 40% | 55% | 70% |
|---|---|---|---|---|---|
| 65% | ≤ 3.8 pp | ≤ 10.3 pp | ≤ 17.7 pp | ≤ 26.5 pp | ≤ 36.9 pp |
| 70% | ≤ 3.6 pp | ≤ 9.7 pp | ≤ 17.0 pp | ≤ 26.0 pp | ≤ 37.0 pp |
| 75% | ≤ 3.2 pp | ≤ 8.9 pp | ≤ 15.9 pp | ≤ 24.7 pp | ≤ 36.3 pp |
| 80% | ≤ 2.8 pp | ≤ 7.8 pp | ≤ 14.1 pp | ≤ 22.6 pp | ≤ 34.3 pp |
| 85% | ≤ 2.2 pp | ≤ 6.3 pp | ≤ 11.8 pp | ≤ 19.3 pp | ≤ 30.6 pp |
Read the corners. Against an 80% favorite at 10% ownership you may give up about three points — almost unfadeable. That same favorite at 70% ownership can be faded for anything at 46% or better. Ownership concentration buys permission to accept risk; "always ride the chalk" and "never ride the chalk" are both wrong, and the table is right.
Step 5: The call
Higher equity wins. Clear the breakeven, we fade; miss it, we ride without guilt. The math, not nerve, is the discipline.
The leg that proved it
Thanksgiving 2025 was the largest natural experiment survivor has produced. With 898 entries alive, the Eagles were owned by 54.3% of the field at a 72.9% no-vig win probability; the Ravens drew 29.9%, the Chiefs 8.7% (Yahoo Sports). Any alternative between 60% and 70% was worth 1.2 to 1.4 times the Eagles' equity. The actual contrarian play, the Bears at 27.1%, was worth 0.55x — negative-EV in expectation. The Bears won, their backers finished as champions, and the play was a leveraged gamble by their own admission: "if the Bears had lost we wouldn't be here" (VSiN). One season, that's a lottery ticket. Fifty seasons, the compounding belongs to the 1.2x decisions, not the 0.55x highlights.
Three teams carried 92.9% of that field. All three lost. Forty-nine entries survived; their implied value jumped from about $20,844 to $381,998 — 18x in four days (Yahoo Sports). You don't have to predict a chalk-train wreck. You just have to hold the leverage ticket when the breakeven says it's cheap.
The honest fine print
Every input carries error: ±3 points around any market-derived win probability, more when the market disagrees with itself. The model treats the field as an average and assumes independence across games. The response isn't abandoning the framework; it's demanding bigger margins when inputs are soft. A perfectly executed season still dies to a 15% event most years. So we keep the decision log and grade the process, not the outcomes.
The machine's Week 1 output is already public. It will be wrong some weeks, and says so in advance — more than most picks columns manage.